A practical guide to cellular IoT technologies – part 2
This is the second instalment in a 2-series of articles on cellular IoT technologies such as LTE-M and NB-IoT. This series is not so much intended for radio network specialists, but rather aims to provide practical, actionable information to users of the technology, focusing on use cases, basic operating principles and performance parameters.
In the previous Instalment (“What is cellular IoT?”) we focused on the key characteristics of the two main cellular IoT technologies – LTE-M and NB-IoT – their performance characteristics, use cases and comparison against other connectivity solutions
In this Instalment (“What are the performance characteristics of NB-IoT and LTE-M?”) we will quantify the performance of each technology in terms of signal strength, latency and signal attenuation by running a set of real-life tests and evaluate their results and provide some practical guidance for real-life deployments of these technologies.
In the final section of this post we will talk about how Teragence provides NB-iOt and LTE-M signal information through its Signal Checker service.

What are the performance characteristics of NB-IoT and LTE-M?
In the previous section we outlined the different cellular LPWAN technologies (NBIOT and LTE-M), their main characteristics and their use cases and we outlined their main characteristics. In this section we will look at what those qualifications mean in reality. Specifically, we will focus on three questions:
- The “operative” signal strength range of NBIOT and LTE-M technologies.
- The actual differences in latency performance between LTE-M and NBIOT and their relationship to signal strength.
- The indoor performance of both technologies.
Approach
To answer these question we conducted a number of LTE-M and NBIOT signal strength tests using an NBIOT/LTE-M signal testing device from SB Scandinavia. This testing device allows for testing of signal strength (RSSI, RSRP, SNR) as well as conducting basic latency tests across both LTE-M and NBIOT. The tests were conducted mainly in the UK on Vodafone’s and O2’s LTE-M and NBIOT’s networks and we conducted approximatively 50 field tests for each technology.
Operative signal range of LTE-M and NB-IoT
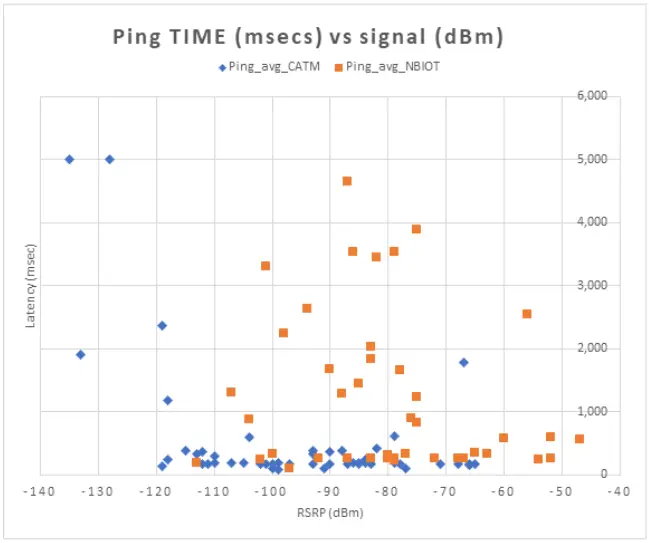
The results of these measurements are plotted on the graph below, comparing the latency with the signal strength for NBIOT and LTE-M. The blue diamonds are LTE-M measurements, the orange squares are NBIOT measurements. We can see that the operative range is between -50dBm and -120 dBm. It is worth noting that at the upper ned of the spectrum, NB-IoT has a range that extends about 15 db more than LTE-M. We will revisit this fact later on in this post.
Latency performance of LTE-M and NB-IoT
We can also see that NB-IoT connections across the board have a higher average latency and a wider variability in latency performance. LTE-M only sees similar variations in latency when the signal is severely degraded. This difference becomes clearer when we draw the trends lines for each technology.
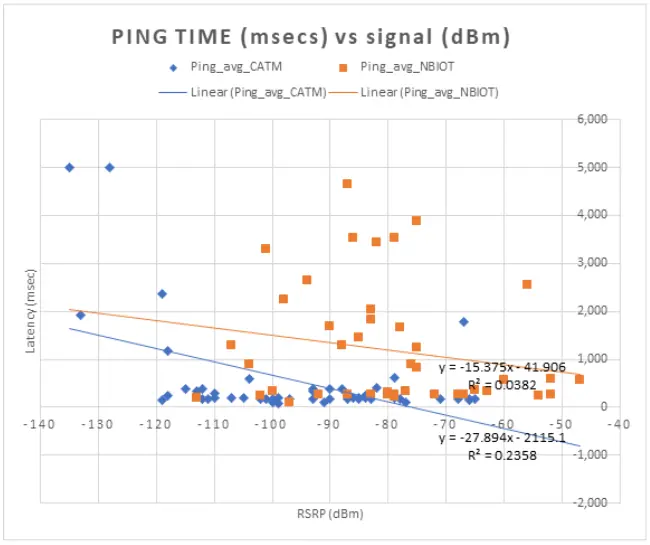
Going by the averages, as defined by the trend lines, NB-IoT has a latency that is typically one second (1,000 msec) longer than the 200-300 msecs observed for LTE-M. But NB-IoT’s variability around the average is orders of magnitude larger than the LTE-M variability (i.e. the LTE-M dots cluster much closer to the trend line than the NB-IoT measurements).
Indoor vs outdoor
Table 2 informed us that NB-IoT should have a higher indoor penetration level than LTE-M. What does that mean in practice? Both LTE-M and NB-IoT technologies are put forward for devices that are installed underground in basements and the likes. How well does this theoretical claim hold up in practice? To investigate this, we did a number of tests moving our test device through different location types (while making sure we remained connected to the same cell). We were able to test 4 different scenarios:
- Outdoor.
- Indoor.
- Underground: Indoor one floor down.
- Deep underground: Indoor two levels down.
Note that the underground scenarios were tested in basements and the likes. We did not test the signal when buried in 2meters of soil.
We ran 9 NB-IoT tests and 13 LTE-M tests. Not every test covered all four scenarios, i.e. for most tests we were able to only run 2 or three tests, but when we bring them all together a clear picture emerges, as reflected in the graph below (NB-IOT measurements are in blue and LTE-M measurements in red).
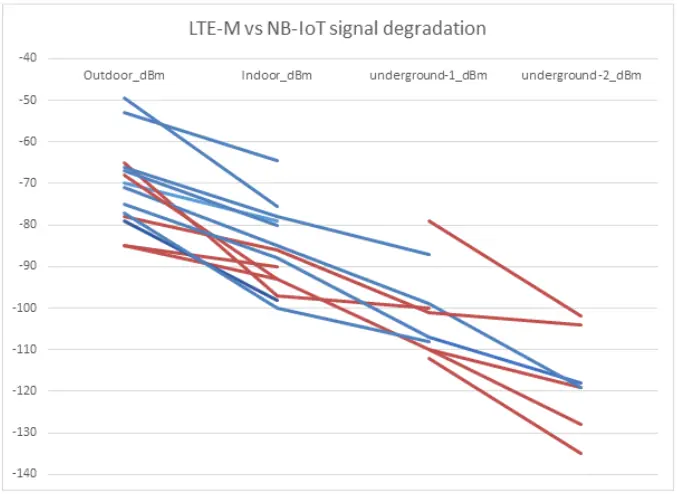
The graph has a certain aesthetic quality, but it does not tell us much: signal strength declines as we move “deeper”, i.e. from indoor to outdoor to below ground. But there does not seem to be much difference between the slope of the red (LTE-M) and blue (NB-IoT) lines. So let’s slice the data a bit differently.
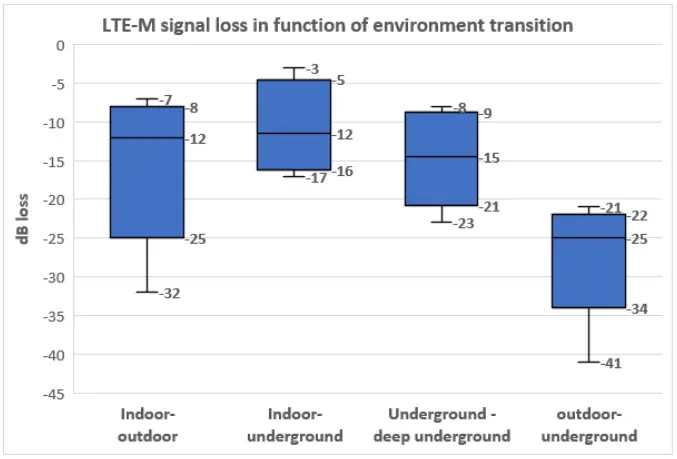
To get a better view of the data, we calculate the db loss for each transition (e.g. outdoor to indoor, indoor to underground) as well as for the transition from outdoor to underground. We plot the results on a box graph, as presented in figure 4:
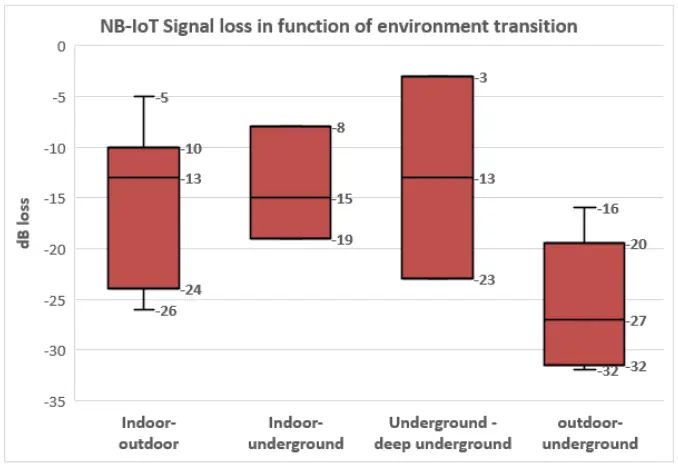
From this graph we can see that, while there is a wide range of signal decline values, the median values for each single transition (i.e outdoor to indoor, indoor to underground,..) are fairly consistent: each single transition causes a loss of about 13 to 15 dB. This is consistent with the results for a 2-layer transition, which results in a median loss of 27 db, i.e. 13.5 db per single transition.
We get very similar results when looking at LTE-M signal loss. Here we get a median signal loss of 12 to 15 dB per transition and a loss 25 dB over 2 transitions.
So if both network protocols suffer the same signal degradation moving from indoor to outdoor, why is NB-IOT generally deemed to be better at indoor penetration? The mathematical explanation is this: each technology will stop to function meaningfully below -120 dBm, but we noticed that the highest signal value obtainable for LTE-M was -65 dBm while for NB-IoT we often registered values upto -50 dBm. Put differently, NB-IoT starts from a much higher level and even with losses of -15 db per layer, can still sustain a decent signal two levels underground if starting from a “high” outside signal level.
Teragence Signal Checker for cellular IoT
Teragence uses crowdsourced data and advanced geo-spatial analytics to draw up a granular, location specific view of cellular signal strength by operator and technology. Most (but not all) of our crowdsourced data comes from consumer handsets, so how do we know what the NBIOT or LTE-M signal strength is? The answer is “by being very clever”.
Before we expand on our cleverness, we need to revisit a few first principles regarding LTE-M and NB-IOT. As we discussed in the previous paragraphes, these technologies operate mainly in B20 (800 Mhz) and to a lesser extent in B3 (1900 Mhz). What’s more the operators need to make certain adjustments in the technology of their celltowers (or BTS’s to use the correct technical term) to enable this specific cellular technology to operate in these bands.
We use this knowledge to develop our own a multi-stage algorithm:
First of all we unpack the crowdsourced 4G signal strength measures by frequency band and we isolate the measures for the relevant operators in the relevant bands. This gives us a “band-specific signal checker” which we build in the same way as our standard signal checker, i.e. by aggregating measures by hexagonal cell and filling in the blanks with our advanced geospatial interpolation algorithms.
Note that at this stage, we do not actually know if there is actual NB-IOT or LTE-M coverage. We only know that there is coverage in the relevant band. We highlight this in our result by classifying a result as “LTE-M (or NBIOT) unconfirmed” – i.e. the given location is theoretically capable of delivering LTE-M or NB-IOT coverage at the given signal strength, but we have no actual evidence to say it is actually possible.
The next step is to assess whether or not there is actual NBIOT or LTE-M coverage. To do this, we work with data sourcing partners in the IoT space. These partners provide us with location and technology-specific coverage information. We combine this data with our band-specific crowdsourced data and cell coverage information to come up with location-specific assessments of NB-IoT and LTE-M coverage . When we confirm that an area is LTE-M or NB-IoT capable, we mark that are as “confirmed”. So when our Signal Checker returns a result that is “confirmed”, you can be sure that this type of technology coverage is available in that location (at the signal strength provided)
In summary, there are now four possible scenarios in our responses with regards to LTE-M and NB-IOT signal strength:
- Measured / Unconfirmed: We have crowdsourced data in that specific location for the band in which the cellular IoT technology operates, but we have not confirmed that the relevant cellular IoT technology is in fact available at that location.
- Measured / Confirmed: We have crowdsourced data in that specific location for the band in which the cellular IoT technology operates, and we have confirmed that the relevant cellular IoT technology is in fact available.
- Calculated / Unconfirmed: We do not have crowdsourced data in that specific location for the band in which the cellular IoT technology operates (and we rely instead on our interpolation algorithms), and we have not confirmed that the relevant cellular IoT technology is in fact available at that location.
- Measured / Confirmed: We do not have crowdsourced data in that specific location for the band in which the cellular IoT technology operates (and we rely instead on our interpolation algorithms), and we have confirmed that the relevant cellular IoT technology is in fact available at that location.
We feel that it most closely aligns with our own philosophy of transparency and accuracy in the way we communicate our results. We invite you to test out this service for yourself via this link: Teragence Signal Checker’s Plans.
Or you can take a look at the video below:
Conclusion
There are significant latency performance differences between LTE-M and NB-IOT with NB-IoT being on average one second slower than LTE-M, but with a high level of variability around that average.
Both technologies see an average decline of 13 db moving “between layers” of indoor vs outdoor, indoor vs underground, etc…, but NB-IoT seems to start from a higher signal level than LTE-M.
Teragence has developed a methodology, combining different data sources to provide quantitative and transparent insights into the LTE-M and NB-IoT coverage through its Singal Checker product.